MACD/Histogram Divergence ToolThis MACD/Histogram indicator helps me to identify divergences and crosses without much effort.
The MACD line is green during a positive cross, and red during a negative.
My favourite feature is the following: when the histogram changes direction, the histogram bars become yellow, which should help you locate divergences without straining yourself.
Example: Upticking (Green) histogram begins to downtick, turns Yellow. Downticking (Red) histogram begins to uptick, turns Yellow as well.
Search in scripts for "macd histogram divergence"

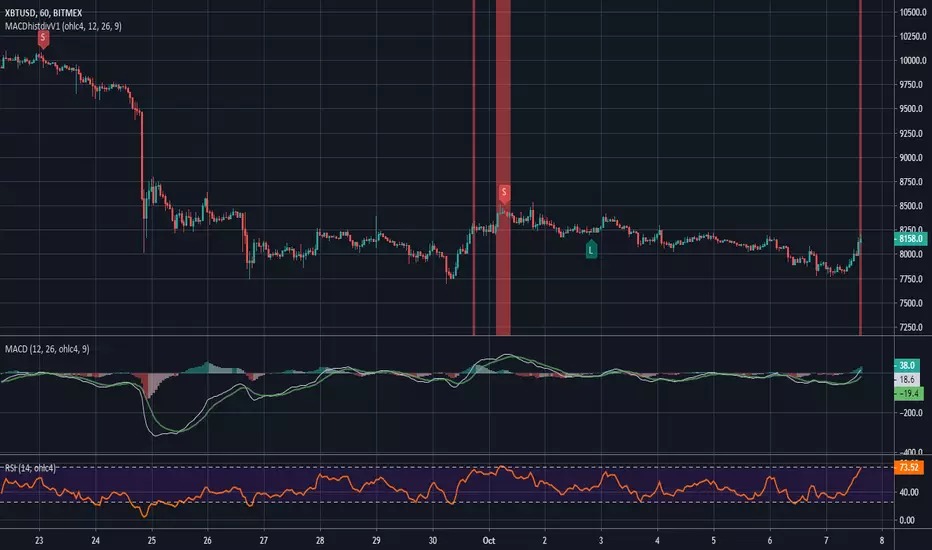
MACD histogram divergence by Rexio v1Hi everyone!
I wrote this indicator for intraday trading and it cannot be use only by itself you need to at least draw some S/R lines to make it useful. It is based at MACD histogram and gives signal when it sees divergence on MACD's Histogram when macd's histogram switchs trend. Im using it to playing with a trend most of the time looking. It highlights candles which can give good singnals to play with a trend (its based on ema200 and RSI overbought and oversold zones).
Im not a computer programist nor professional trader so it is only for educational purposes only.
MACDh with divergences & impulse system (overlayed on prices)-----------------------------------------------------------------
General Description:
This indicator ( the one on the top panel above ) consists on some lines, arrows and labels drawn over the price bars/candles indicating the detection of regular divergences between price and the classic MACD histogram (shown on the low panel). This script is special because it can be adjusted to fit several criteria when trading divergences filtering them according to the "height" and "width" of the patterns. The script also includes the "extra features" Impulse System and Keltner Channels, which you will hardly find anywhere else in similar classic MACD histogram divergence indicators.
The indicator helps to find trend reversals, and it works on any market, any instrument, any timeframe, and any market condition (except against really strong trends that do not show any other sign of reversion yet).
Please take on consideration that divergences should be taken with caution.
-----------------------------------------------------------------
Definition of classic Bullish and Bearish divergences:
* Bearish divergences occur in uptrends identifying market tops. A classical or regular bearish divergence occurs when prices reach a new high and then pull back, with an oscillator (MACD histogram in this case) dropping below its zero line. Prices stabilize and rally to a higher high, but the oscillator reaches a lower peak than it did on a previous rally.
In the chart above (weekly charts of NKE, Nike, Inc.), in area X (around August 2021), NKE rallied to a new bull market high and MACD-Histogram rallied with it, rising above its previous peak and showing that bulls were extremely strong. In area Y, MACD-H fell below its centerline and at the same time prices punched below the zone between the two moving averages. In area Z, NKE rallied to a new bull market high, but the rally of MACD-H was feeble, reflecting the bulls’ weakness. Its downtick from peak Z completed a bearish divergence, giving a strong sell signal and auguring a nasty bear market.
* Bullish divergences , in the other hand, occur towards the ends of downtrends identifying market bottoms. A classical (also called regular) bullish divergence occurs when prices and an oscillator (MACD histogram in this case) both fall to a new low, rally, with the oscillator rising above its zero line, then both fall again. This time, prices drop to a lower low, but the oscillator traces a higher bottom than during its previous decline.
In the example in the chart above (weekly charts of NKE, Nike, Inc.), you see a bearish divergence that signaled the October 2022 bear market bottom, giving a strong buy signal right near the lows. In area A, NKE (weekly charts) appeared in a free fall. The record low A of MACD-H indicated that bears were extremely strong. In area B, MACD-H rallied above its centerline. Notice the brief rally of prices at that moment. In area C, NKE slid to a new bear market low, but MACD-H traced a much more shallow low. Its uptick completed a bullish divergence, giving a strong buy signal.
-----------------------------------------------------------------
Some cool features included in this indicator:
1. This indicator also includes the “ Impulse System ”. The Impulse System is based on two indicators, a 13-day exponential moving average and the MACD-Histogram, and identifies inflection points where a trend speeds up or slows down. The moving average identifies the trend, while the MACD-Histogram measures momentum. This unique indicator combination is color coded into the price bars for easy reference.
Calculation:
Green Price Bar: (13-period EMA > previous 13-period EMA) and
(MACD-Histogram > previous period's MACD-Histogram)
Red Price Bar: (13-period EMA < previous 13-period EMA) and
(MACD-Histogram < previous period's MACD-Histogram)
Price bars are colored blue when conditions for a Red Price Bar or Green Price Bar are not met. The MACD-Histogram is based on MACD(12,26,9).
The Impulse System works more like a censorship system. Green price bars show that the bulls are in control of both trend and momentum as both the 13-day EMA and MACD-Histogram are rising (you don't have permission to sell). A red price bar indicates that the bears have taken control because the 13-day EMA and MACD Histogram are falling (you don't have permission to buy). A blue price bar indicates mixed technical signals, with neither buying nor selling pressure predominating (either both buying or selling are permitted).
2. Another "extra feature" included here is the " Keltner Channels ". Keltner Channels are volatility-based envelopes set above and below an exponential moving average.
3. It were also included a couple of EMAs.
Everything can be removed from the chart any time.
-----------------------------------------------------------------
Options/adjustments for this indicator:
*Horizontal Distance (width) between two tops/bottoms criteria.
Refers to the horizontal distance between the MACH histogram peaks involved in the divergence
*Height of tops/bottoms criteria (for Histogram).
Refers to the difference/relation/vertical distance between the MACH HISTOGRAM peaks involved in the divergence: 1st Histogram Peak is X times the 2nd.
*Height/Vertical deviation of tops/bottoms criteria (for Price).
Deviation refers to the difference/relation/vertical distance between the PRICE peaks involved in the divergence.
*Plot Regular Bullish Divergences?.
*Plot Regular Bearish Divergences?.
*Delete Previous Cancelled Divergences?.
*Shows a pair of EMAs.
*Shows Keltner Channels (using ATR)
Keltner Channels are volatility-based envelopes set above and below an exponential moving average.
*This indicator also has the option to show the Impulse System over the price bars/candles.

MACDh with divergences & impulse system-----------------------------------------------------------------
General Description:
This indicator ( the one on the low panel ) is a classic MACD that also shows regular divergences between its histogram and the prices. This script is special because it can be adjusted to fit several criteria when trading divergences filtering them according to the "height" and "width" of the patterns. The script also includes the "extra feature" Impulse System, which you will hardly find anywhere else in similar classic MACD histogram divergence indicators.
The indicator helps to find trend reversals, and it works on any market, any instrument, any timeframe, and any market condition (except against really strong trends that do not show any other sign of reversion yet).
Please take on consideration that divergences should be taken with caution.
-----------------------------------------------------------------
Definition of classic Bullish and Bearish divergences:
* Bearish divergences occur in uptrends identifying market tops. A classical or regular bearish divergence occurs when prices reach a new high and then pull back, with an oscillator (MACD histogram in this case) dropping below its zero line. Prices stabilize and rally to a higher high, but the oscillator reaches a lower peak than it did on a previous rally.
In the chart above (weekly charts of NKE, Nike, Inc.), in area X (around August 2021), NKE rallied to a new bull market high and MACD-Histogram rallied with it, rising above its previous peak and showing that bulls were extremely strong. In area Y, MACD-H fell below its centerline and at the same time prices punched below the zone between the two moving averages. In area Z, NKE rallied to a new bull market high, but the rally of MACD-H was feeble, reflecting the bulls’ weakness. Its downtick from peak Z completed a bearish divergence, giving a strong sell signal and auguring a nasty bear market.
* Bullish divergences , in the other hand, occur towards the ends of downtrends identifying market bottoms. A classical (also called regular) bullish divergence occurs when prices and an oscillator (MACD histogram in this case) both fall to a new low, rally, with the oscillator rising above its zero line, then both fall again. This time, prices drop to a lower low, but the oscillator traces a higher bottom than during its previous decline.
In the example in the chart above (weekly charts of NKE, Nike, Inc.), you see a bearish divergence that signaled the October 2022 bear market bottom, giving a strong buy signal right near the lows. In area A, NKE (weekly charts) appeared in a free fall. The record low A of MACD-H indicated that bears were extremely strong. In area B, MACD-H rallied above its centerline. Notice the brief rally of prices at that moment. In area C, NKE slid to a new bear market low, but MACD-H traced a much more shallow low. Its uptick completed a bullish divergence, giving a strong buy signal.
-----------------------------------------------------------------
Extra feature: Impulse System
This indicator also includes the “ Impulse System ”. The Impulse System is based on two indicators, a 13-day exponential moving average and the MACD-Histogram, and identifies inflection points where a trend speeds up or slows down. The moving average identifies the trend, while the MACD-Histogram measures momentum. This unique indicator combination is color coded into the price bars or macd histogram bars for easy reference.
Calculation:
Green Price Bar: (13-period EMA > previous 13-period EMA) and
(MACD-Histogram > previous period's MACD-Histogram)
Red Price Bar: (13-period EMA < previous 13-period EMA) and
(MACD-Histogram < previous period's MACD-Histogram)
Histogram bars are colored blue when conditions for a Red Histogram Bar or Green Histogram Bar are not met. The MACD-Histogram is based on MACD(12,26,9).
The Impulse System works more like a censorship system. Green histogram bars show that the bulls are in control of both trend and momentum as both the 13-day EMA and MACD-Histogram are rising (you don't have permission to sell). A red histogram bar indicates that the bears have taken control because the 13-day EMA and MACD Histogram are falling (you don't have permission to buy). A blue histogram bar indicates mixed technical signals, with neither buying nor selling pressure predominating (either both buying or selling are permitted).
The impulse system can be removed from the chart any time.
-----------------------------------------------------------------
Options/adjustments for this indicator:
*Horizontal Distance (width) between two tops/bottoms criteria.
Refers to the horizontal distance between the MACH histogram peaks involved in the divergence
*Height of tops/bottoms criteria (for Histogram).
Refers to the difference/relation/vertical distance between the MACH HISTOGRAM peaks involved in the divergence: 1st Histogram Peak is X times the 2nd.
*Height/Vertical deviation of tops/bottoms criteria (for Price).
Deviation refers to the difference/relation/vertical distance between the PRICE peaks involved in the divergence.
*Plot Regular Bullish Divergences?.
*Plot Regular Bearish Divergences?.
*Delete Previous Cancelled Divergences?.
*This indicator also has the option to show the Impulse System over the MACD histogram bars

Range Oascilator + LessDivergences + MACD+StochRSIRange Oscillator + EMA Filter
Calculates a custom oscillator based on the highest high and lowest low over a chosen period.
Generates BUY signals when the oscillator crosses up from the oversold zone and price is above the EMA.
Generates SELL signals when the oscillator crosses down from the overbought zone and price is below the EMA.
MACD (3‑10‑16 EMA Settings)
Uses fast EMA = 3, slow EMA = 10, signal EMA = 16.
Detects bullish and bearish crossovers.
These crossovers only trigger a single unified buy/sell signal if they coincide with Stochastic RSI being in oversold (for buy) or overbought (for sell) zones.
Stochastic RSI
Standard calculation with %K and %D smoothing.
Defines oversold (<20) and overbought (>80) zones.
Used both for divergence detection and as a filter for MACD signals.
Divergence Detection
RSI Divergence: Price makes a lower low but RSI makes a higher low (bullish), or price makes a higher high but RSI makes a lower high (bearish).
MACD Histogram Divergence: Price makes a lower low but MACD histogram makes a higher low (bullish), or price makes a higher high but MACD histogram makes a lower high (bearish).
Stochastic RSI Divergence: Similar logic applied to %K line.
Divergences are flagged only once per pivot to avoid repetitive signals.
Visuals
EMA plotted on chart.
BUY/SELL signals shown as triangles above/below bars.
Divergences shown as labels (e.g., “RSI BullDiv”, “MACD BearDiv”).
Unified MACD+Stoch RSI signals shown in distinct colors (lime for buy, orange for sell).

MACD Divergence auto displayed on chart, with alertsMACD Pivot Divergence Detector
This tool identifies MACD histogram divergences based on confirmed pivot highs and lows.
Instead of comparing swing points on the MACD line, this script focuses specifically on the histogram, which measures momentum shifts between MACD and Signal.
How it works
The script detects confirmed pivots using a two-bar swing structure.
When price breaks above a previous pivot high, the script compares the MACD histogram value at that pivot to the current histogram value:
• If price makes a higher high while the histogram makes a lower high, a potential bearish divergence is marked.
The reverse logic is applied for bullish divergence when price breaks below a pivot low.
What makes this script unique
It uses pivot-confirmed histogram values, not lookback-based divergence.
It evaluates divergence only at actual highs/lows, reducing false positives.
It marks divergence directly on the candles for visual clarity.
Alert conditions are included for automated detection.
How to use
Bullish signals may highlight potential momentum loss in downtrends; bearish signals may highlight momentum loss near highs. Divergence does not guarantee reversal and should be combined with broader context, structure, or trend analysis.
